Why do we care?
they can sweep through the society with catastrophic effects not only on public health, but social institutions and the economy as well. Social cohesion is further diminished if poor or minority families suffer more from infectious disease than middle class whites. The control of such diseases is therefore critical to sustain well-being and social stability.
How are we doing?
Figure 23.1 shows the rate of newly reported cases of three major infectious diseases in New Jersey since the mid-1980s. As it shows, the rates of some key infectious diseases have decreased since the 1980s. AIDS cases peaked in 1993, decreased through 1998, and since then have leveled off. In 2002, the rate of new AIDS cases was 16.3 per 100,000, which is about a quarter of the level of 1993, 64.1. Syphilis cases per 100,000 decreased dramatically from 22.0 in 1990 to 0.8 in 2000. Some experts have suggested that this decline may be a direct result of sexual behavior changes in response to concerns with AIDS. In addition, at 6.2 per 100,000 in 2002, verified tuberculosis cases were at their lowest level of the past 15 years.
The New Jersey Department of Health established targets for the reduction of infectious disease in their 2001 report Healthy New Jersey 2010.(1) By 2010, the goal was to reduce the AIDS rate to 14.6 per 100,000, the tuberculosis rate to 2.4 per 100,000, and the primary and secondary syphilis rate to 0.5 per 100,000. The Department’s strategies for working towards these goals place a strong emphasis on surveillance, to make sure that public officials know of new cases and can take steps needed to prevent them from spreading further. On TB, the Department is working to ensure that those with active TB complete their treatment as prescribed, to reduce the spread of infection and prevent the development of antibiotic resistant strains. If current trends continue, these goals may be reached for tuberculosis and syphilis, but the prospect is not as encouraging for AIDS.
What is behind these figures?
In the past twenty years, some infectious diseases thought to be under control have reemerged. Tuberculosis (TB) became a problem in the mid-1980s due to the emergence of multiple drug resistant strains, an increase in its incidence among immigrants and refugees, and the high risk of disease transmission posed by individuals with dual HIV/TB infection. When patients with the disease do not fully maintain their drug regimens, the strain with which they are infected can become resistant to the drugs. When the resistant strain spreads, medications are less effective in treating new victims. The prevalence of tuberculosis in hard-to-reach populations such as drug users, those with HIV, and the homeless has made this a significant problem. The rate of infectious disease varies significantly by race in New Jersey. As of December 2002, whites accounted for only 27% of reported adult AIDS cases, although they account for 73% of the state population. In contrast, Hispanics accounted for 17% of recorded AIDS cases as compared with 13% of the population, and blacks accounted for 56% of AIDS cases but 14% of the population. (2)
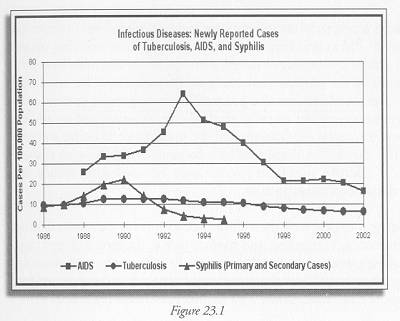
Figure 23.1 AIDS: NJ Department of Health & Senior Services, Division of HIV/AIDS Services (DHAS), New Jersey HIV/AIDS Semi-annual Newsletter, http://www.state.nj.us/health/aids/aidsqtr.htm
Table 1 of each issue of the newsletter provides updated data on new adult and adolescent AIDS cases. Tuberculosis: Data through 1998 at http://www.state.nj.us/health/cd/tbstats/tb1.htm
Later data at http://www.state.nj.us/health/cd/tbstats/tb12000.htm
Syphilis: NJDHSS, Communicable Disease Program, Sexually Transmitted Disease Service, Sexually Transmitted Diseases and Tuberculosis Morbidity, http://www.state.nj.us/health/cd/stdstats/
Indicator Target:
By 2010 reduce infectious disease rates per 100,000 to:
AIDS: 14.6
Tuberculosis: 2.4
Syphilis: 0.5
Current (2000) rates:
AIDS: 22.2
Tuberculosis: 6.7
Syphilis: 0.8
Who set the targets?:
New Jersey Department of Health, Healthy New Jersey2010, http://www.state.nj.us/health/chs/hnj2010vol2.pdf
———-
(1) New Jersey Department of Health and Senior Services, June 2001, Healthy New Jersey 2010, A Health Agenda for the First Decade of the New Millennium, pp. 177-180. http://www.state.nj.us/health/chs/hnj2010vol2.pdf
(2) New Jersey Department of Health and Senior Services, New Jersey HIV/AIDS Surveillance Report December 31, 2002. Table 1, NJ Adult/Adolescent AIDS Cases. http://www.state.nj.us/health/aids/qtr0212.pdf