Why do we care?
Life expectancy measures the average number of years of life remaining to a person at a given age. It reflects the health and well-being of our population, and our relative access to resources and services that help keep us alive. Longer lives place more impact on the environment, however, and therefore require us to take responsibility for our actions and their consequences.
How are we doing?
Figure 22.1 shows trends in life expectancy at birth from 1990 to 2000 for all New Jerseyans, and for whites and blacks separately. While all life expectancies rose slightly over the decade, they have been substantially higher for whites than for blacks throughout the decade. This reflects an array of social conditions that differ by race; infant mortality, income, access to effective medical care, access to pre-natal care, nutrition, and so on. Projection of the trends of the past ten years suggests that whites are likely to meet the 2010 target of 81.0 set by the NJ Department of Health and Senior Services, while blacks are not likely to reach the target of 76.5. This racial inequity in life expectancy across the society needs to be addressed.
What is behind these figures?
Life expectancy at birth tells us the number of years that a person born in a given year is expected to live. The average life expectancy of a baby born in New Jersey in 2000 was 77.6 years. Life expectancy increases with age, so in the same year the life expectancy of a 65-year old was over 82 years. A grandmother has already lived through many risks; having successfully bypassed them, she is likely to live longer than was expected when she was born.
New Jersey data clearly illustrate the common perception that women outlive men. Figure 22.2 compares life expectancies of men and women through the 1990s. Though men’s life expectancies have improved over the decade more than women’s, women still may be expected to live significantly longer than their male counterparts.
What else would we like to know?
Life expectancies are calculated based on data on births, deaths, and population. New Jersey data on deaths for races other than white and black are less available. Consequently, life expectancy estimates are available only for whites and blacks, but not for Hispanics or other racial groups. These additional data would give us a better understanding of the inequities in our state in access to health care, nutrition, safe homes and jobs, and other factors contributing to longer life.
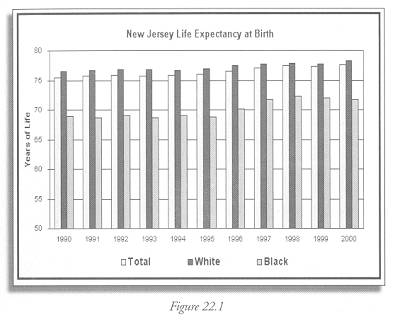
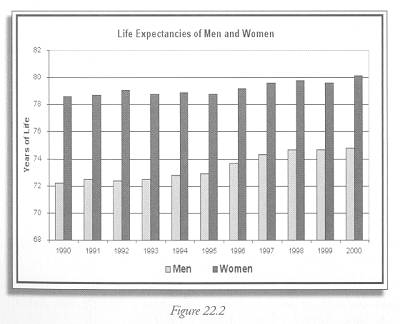
Figure 22.1 & 22.2
The most current data are available on the web at New Jersey Health Statistics 2000, Table M10. Life Expectancy at Birth by Race and Sex, http://www.state.nj.us/health/chs/stats00/mort00.pdf#m10.
Earlier data may be accessed through http://www.state.nj.us/health/chs/hlthstat.htm
Indicator Target:
By 2010, increase life expectancy at birth to:
White: 81.0
Black: 76.5
Current (2000) level:
White: 80.1
Black: 74.8
Source: Healthy New Jersey 2010, http://www.state.nj.us/health/chs/hnj2010vol2.pdf