Why do we care?
In 2000, New Jerseysans generated over 17 million tons of solid waste, of which 8.3 million tons were buried in landfills or burned in incinerators. This can lead to groundwater pollution, poor air quality, land contamination, and other forms of environmental degradation. Furthermore, political and social battles over where to locate and how to pay for waste disposal facilities have been historically contentious. Minimizing our generation of solid waste will help resolve all of these problems, contributing to sustainability from economic, social, and environmental perspectives.
How are we doing?
Data on waste generation per capita since 1985 show a cyclical but increasing trend, as Figure 40.1 illustrates. Waste generation rates are related to prosperity and increases in economic activity, so it is not surprising that we see this substantial increase over time.
What is behind these figures?
The traditional adage on solid waste is “reduce, reuse, recycle” – and only after that, throw it out. New Jersey’s prosperity gives us little incentive to reduce material use in the first place, as would be the case if our incomes were lower. In countries where materials and money are scarce, packaging is a rare luxury, whereas here it is the norm.
The same is largely true for reuse. New Jersey bottlers do not reuse glass or plastic drink containers; few people reuse plastic shopping bags or bring their own containers to purchase food or other goods. Many people throw out used furniture, toys, clothes, or books rather than finding someone else who could use them. Building materials at demolition sites are often landfilled rather than reused; outdated electronics equipment is dumped with no effort to reuse the materials used to manufacture them. Few people even print or photocopy double- sided in order to reduce paper use. Reducing material consumption in the first place, or reusing materials many times, are the least expensive ways to manage solid waste, but virgin materials are too cheap – and our time perhaps too expensive – for most of us to bother. Recycling, the least beneficial of the three options, increased substantially in New Jersey until a mid-1990s Supreme Court decision declaring certain state trash management policies to be in restriction of interstate trade had the unintended consequence of reducing recycling levels in the state.(1) The state set a recycling target of 65% by the end of 2000, which we did not achieve, as shown in Figure 40.2. Though the share of material recycled has decreased since 1997, the total amount recycled has remained high over time.
What else would we like to know?
With detailed information about the composition of our waste and recycling streams, we would be able to assess how we could improve our performance in all of these areas.
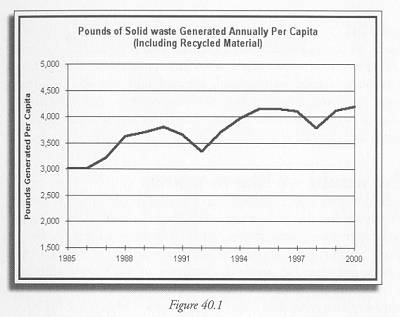
Figure 40.1
Calculated based on solid waste data from NJ DEP, Division of Solid and Hazardous Waste, “New Jersey Solid Waste Database Trends Analysis (1985 through 2000)” http://www.state.nj.us/dep/dshw/recycle/8599trnd.htm and population data from the Bureau of Economic Analysis, http://www.bea.gov/bea/regional/spi/.
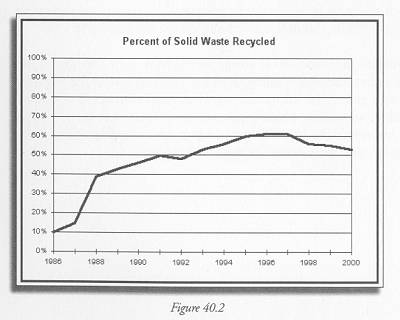
Figure 40.2
NJ DEP, Division of Solid and Hazardous Waste, “New Jersey Solid Waste Database Trends Analysis (1985 through 2000)” http://www.state.nj.us/dep/dshw/recycle/8599trnd.htm
Indicator Target:
Targets with which to assess state progress have not yet been established for this indicator.
———-
(1) Carbone vs. Town of Clarkstown. 511 US383 (1994).