Why do we care?
The ability to live in a safe community is an important element of sustainability. If we are afraid on our streets or in our own homes, we cannot be comfortable in society. Moreover, crime is an indicator of deeper social and economic issues. An increase in the crime rate may result from a decrease in job opportunity, economic stagnation, inadequate education, or inadequate policing.
How are we doing?
Figure 11.1 shows the trends in violent and non-violent crime rates in New Jersey since the late 1960s. Violent crimes consist of murder, rape, robbery, and aggravated assault. Nonviolent crimes consist of burglary, larceny-theft, and motor vehicle theft. As the figure shows, the rate of violent crime has been relatively stable over the past forty years, while the rate of non-violent crimes rose sharply in the early 1980s and has dropped significantly since then. New Jersey experienced its highest rates of both nonviolent and violent crime in the early 1980s.
What is behind these figures?
The causes of fluctuations in the crime rate are difficult to pinpoint. The recession of the early 1980s, one of the highest periods of unemployment in many years, may have significantly contributed to the peaks at that time. In 1980, the unemployment rate for the state was 7.2 percent, (see Indicator 2 for more on unemployment).(1) The poverty rate was also increasing in the early 1980s, climbing to over 12 percent by 1983 (see Indicator 4 for more on poverty).
The entire country experienced a decrease in crime in the 1990s, so we cannot attribute the change in New Jersey to the policing policies of a particular local government or police force. The possible link between crime and periods of falling prosperity would suggest that we might have expected an upswing in 2002; however, there was in fact a slight decline from 2001 to 2002.
What else would we like to know?
To reduce crime, we need a better understanding of how it relates both to other social indicators and to public policies to control it. We may also be interested in measuring the perception of crime; whether people feel unsafe may not be directly related to the actual level of threat. Crime rates vary greatly between urban, suburban, and rural areas, as well; better data on where crimes occur and who the victims are will also help us understand who is actually at risk, so we can better target our protection efforts.
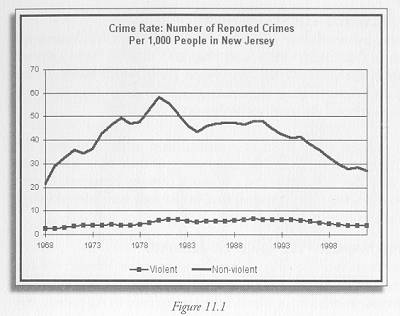
Figure 11.1 NJ Division of State Police. Uniform Crime Report, Crime Index for the State, http://www.state.nj.us/lps/njsp/info/stats.html for general crime information.http://www.state.nj.us/lps/njsp/info/ucr2002/pdf/2002_sect2.pdf for most current data.
Indicator Target:
Targets with which to assess state progress have not yet been established for this indicator.
———-
(1) http://www.wnjpin.net/OneStopCareerCenter/LaborMarketInformation/lmi11/anavg.htm